Q4FY2019 Result Update | NBFC
May 25, 2019
Shriram Transport Fin Co
BUY
CMP
`1,106
Performance Highlights
Target Price
`1,470
Investment Period
12 Months
Particulars (` cr)
4QFY19
3QFY19
% chg (qoq) 4QFY18
% chg (yoy)
NII
1,906
2,027
-6.0
1,855
2.8
Sector
NBFC
Pre.Prov. Profit
1,512
1,620
-6.7
1,605
-5.8
Market Cap (` cr)
25,114
PAT
746
635
17.4
962
-22.4
Beta
1.4
Source: Company
52 Week High / Low
1559/903
For Q4FY2019, STFC reported subdued numbers, NII grew -6/3% and AUM grew
Avg. Daily Volume
39,722
by 1%/9% on qoq/yoy. The primary reason behind moderate growth in AUM was
Face Value (`)
10
lackluster real estate activity, slowdown in demand of CV as well as election period.
BSE Sensex
39,434
Provisions during the quarter were `540cr against `97cr in 4QFY2018.
Nifty
11,844
AUM growth moderated; pressure on NIM: During the quarter, STFC reported
Reuters Code
SRTS.NS
AUM growth of 9% yoy, led by working capital (61% yoy on low base) and business
Bloomberg Code
SHTF.IN
loan (14% yoy). The reported NIM declined 28bps yoy (22bps qoq), due to increase
in lower yield investment and higher disbursement towards at the end of quarter.
Shareholding Pattern (%)
The cost-income ratio increased 91bps yoy to 22.1% as the company continued
investment into manpower and branches during the year. Credit cost sequentially
Promoters
26.1
decreased 38bps to 2.07%, and management has given guidance of 2% credit cost
MF / Banks / Indian Fls
3.9
for FY2020.
FII / NRIs / OCBs
52.1
Indian Public / Others
17.9
On asset quality front, GNPA declined from 8.78% to 8.37% sequentially, while
NNPA decline from 5.86% to 5.49% qoq. Provision coverage ratio remained stable
at 70%. We expect GNPA/NPA to stabiles as the transition to 90dpd and Ind AS
Abs.(%)
3m 1yr 3yr
completes.
Sensex
8.9
13.8
55.8
Outlook & Valuation: We expect STFC’s AUM to grow at CAGR of 16% over
SHTF
0.8
(25.0)
(4.2)
FY2019-21E primarily owing to (1) post election government to increase spending
on infra project (macro recovery), and (2) pre-buying of CV before the BS VI will
also improve the pricing of older vehicles. We expect STFC to report RoA/RoE to
2.7%/17.6% in FY2021E respectively. At CMP, the stock is trading at 1.3x FY2021E
ABV and 7x FY2021E EPS, which we believe is reasonable for differentiated
3-year price chart
business model with return ratios. We recommend a BUY on the stock with a Target
1800
Price of `1,470.
1500
1200
Exhibit 1: Key Financials
900
Y/E March (` cr)
FY18
FY19
FY20E
FY21E
600
NII
6,800
7,808
8,804
10,305
YoY Growth (%)
22.3
14.8
12.8
17.0
PAT
2,460
2,562
2,910
3,531
Source: Company, Angel Research
YoY Growth (%)
95.7
4.2
13.6
21.3
EPS
108
113
128
156
Adj Book Value
504
607
696
815
P/E
10
9
8
7
Jaikishan J Parmar
P/Adj.BV
2.1
1.7
1.5
1.3
Research Analyst
ROE (%)
19.8
17.4
17.0
17.6
022 39357600, Extn: 6810
ROA (%)
2.9
2.5
2.6
2.7
Source: Company, Note: CMP as of 25/05/2019
Please refer to important disclosures at the end of this report
1
Shriram Transport Fin Co | 4QFY2019 Result Update
Exhibit 1: Quarterly Summary
Particular (` cr)
4QFY18
1QFY19
2QFY19
3QFY19
4QFY19
% QoQ
% YoY
Total Interest Income
3,572
3,732
3,917
3,968
3,845
(3)
8
Interest Expenses
1,717
1,851
1,862
1,941
1,939
(0)
13
Net Interest Income (NII)
1,855
1,881
2,055
2,027
1,906
(6)
3
Other Income
173
7
24
26
35
34
(80)
Total Income
3,745
3,740
3,942
3,994
3,880
(3)
4
Net Income
2,028
1,888
2,080
2,053
1,941
(5)
(4)
Operating Expenses
423
472
458
433
429
(1)
1
Employee Expenses
206
225
232
222
204
(8)
(1)
Other Operating Expenses
217
247
226
211
225
6
4
Operating Profit
1,605
1,416
1,622
1,620
1,512
(7)
(6)
Provisions
97
533
684
636
540
(15)
455
PBT
1,508
883
938
984
972
(1)
(36)
Provisions for Tax
546
310
329
348
226
(35)
(59)
Tax Rate %
36
35.1
35.1
35.4
23.3
(34)
(36)
PAT
962
573
609
635
746
17
(22)
Profitability
C/I
21.2
25.0
22.0
21.1
22.1
101
91
ROE
4.6
17.2
17.0
17.2
19.4
217
1,472
Calc -Yield - AUM
14.05
15.25
15.29
15.25
14.77
(48)
72
Calc -Yield - Advance
16.89
18.42
18.40
18.42
18.13
(28)
124
Reported NIM
7.5
7.44
7.52
7.44
7.22
(22)
(28)
Calc - COF
8.3
9.97
8.59
8.74
8.74
0
42
Spread
8.6
8.5
9.8
9.7
9.4
(29)
83
Source: Company, Angel Research
Exhibit 2: Asset Quality
Particular (` cr)
4QFY18
1QFY19
2QFY19
3QFY19
4QFY19
% QoQ
% YoY
GNPA
7,376
7,459
7,749
7,641
7,100
(7)
(4)
NNPA
2,131
2,132
2,278
2,221
2,055
(7)
(4)
Gross NPAs (%)
9.15
8.98
8.77
8.97
8.29
(68)
(86)
Net NPAs (%)
2.83
2.74
2.75
2.78
2.55
(23)
(28)
PCR (Calculated, %)
69
69
69
69
69
23
17
Credit Cost (Annualised) AUM
0.4
2.1
2.6
2.5
2.1
(38)
166
GS 3
9,084
9,157
9,092
9,033
8,623
(5)
(5)
GS 3 %
9.5
9.1
8.7
8.7
8.3
(5)
(13)
ECL prov stage 3
3,286
3,118
3,113
3,187
2,967
(7)
(10)
Net Stage 3
5,799
6,039
5,979
5,846
5,656
(3)
(2)
Coverage Ratio Stage 3
36
34
34
35
34
(87)
(179)
GS 1& 2
87,617
91,879
96,173
93,875
94,358
1
8
ECL Prov stage 1& 2
2,364
2,341
2,604
2,651
2,604
(2)
10
Net Stage 1 & 2
85,253
89,538
93,568
91,224
91,755
1
8
ECL Prov (%) Stage 1&2
2.70
2.55
2.71
2.82
2.76
(6)
6
Source: Company, Angel Research
May 25, 2019
2
Shriram Transport Fin Co | 4QFY2019 Result Update
Exhibit 3: AUM Break-up
Particular (` cr)
4QFY18
1QFY19
2QFY19
3QFY19
4QFY19
% QoQ
% YoY
New
11,042
12,140
12,719
12,077
11,594
(4)
5
Used
80,784
83,919
86,057
86,126
87,050
1
8
Business Loan
2,611
2,978
3,314
3,182
2,971
(7)
14
Working Capital
1,741
1,895
2,171
2,365
2,807
19
61
Others
81
46
119
68
60
(12)
(26)
Total AUM
96,260
1,00,978
1,04,380
1,03,818
1,04,482
1
9
Source: Company, Angel Research
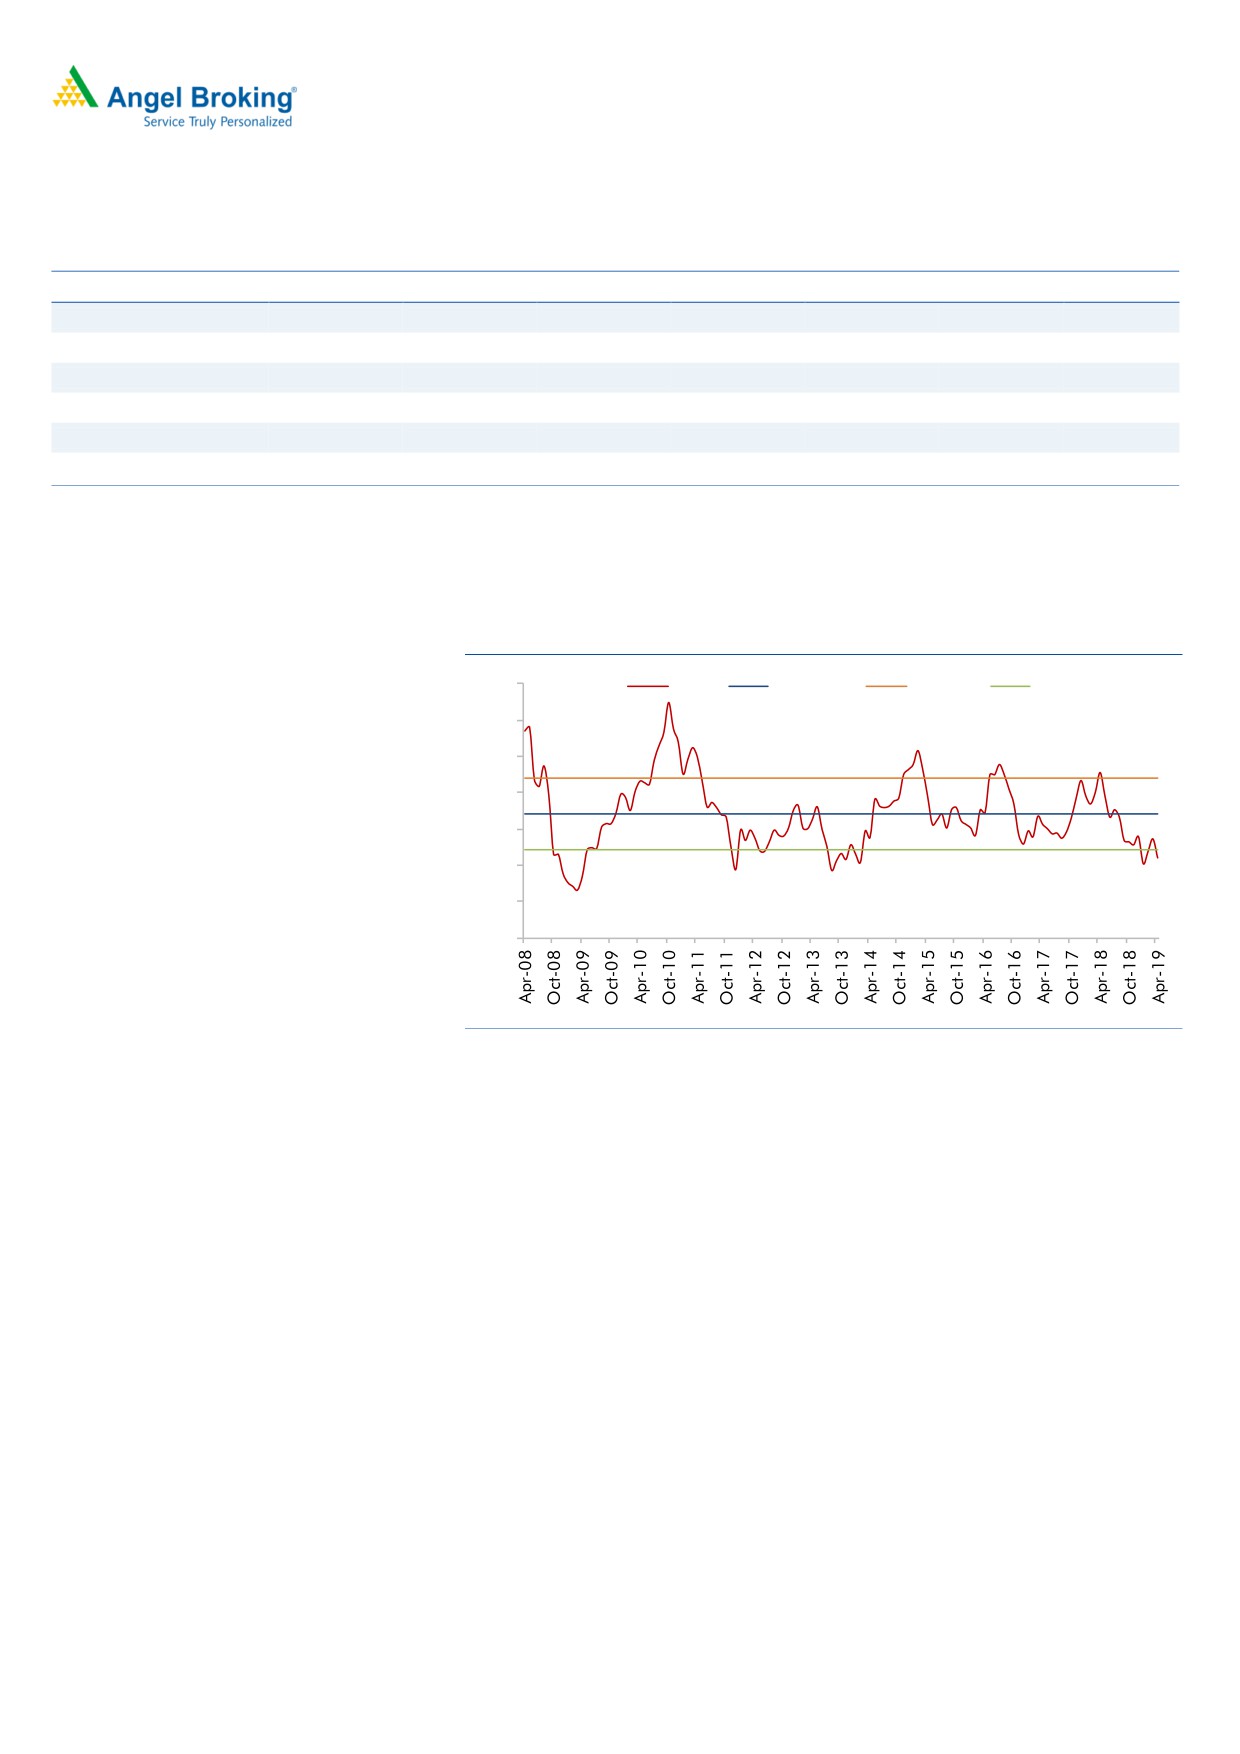
Exhibit 4: 1 year forward P/B
4
P/BV
Avg. P/BV
+1STD
-1STD
3.5
3
2.71
2.5
2.21
2
1.5
1.71
1.6
1
0.5
Source: Company, Closing rate as on 23/5/19
Outlook & Valuation: We expect STFC’s AUM to grow at CAGR of 16% over
FY2019-21E primarily owing to (1) post election government to increase spending
on infra project (macro recovery), and (2) pre-buying of CV before the BS VI will
also improve the pricing of older vehicles. We expect STFC to report RoA/RoE to
2.7%/17.6% in FY2021E respectively. At CMP, the stock is trading at 1.3x
FY2021E ABV and 7x FY2021E EPS, which we believe is reasonable for
differentiated business model with return ratios. We recommend a BUY on the
stock with a Target Price of `1,470.
May 25, 2019
3
Shriram Transport Fin Co | 4QFY2019 Result Update
Income Statement
Y/E March (` cr)
FY18
FY19
FY20E
FY21E
NII
6,800
7,808
8,804
10,305
- YoY Growth (%)
22.3
14.8
12.8
17.0
Other Income
215
101
113
130
- YoY Growth (%)
162.8
-53.0
11.4
15.5
Operating Income
7,015
7,909
8,916
10,435
- YoY Growth (%)
24.3
12.7
12.7
17.0
Operating Expenses
1,492
1,750
2,023
2,346
- YoY Growth (%)
17.0
17.3
15.6
15.9
Pre - Provision Profit
5,524
6,159
6,893
8,089
- YoY Growth (%)
26.4
11.5
11.9
17.3
Prov. & Cont.
1,722
2,382
2,484
2,739
- YoY Growth (%)
-29.5
38.3
4.3
10.3
Profit Before Tax
3,801
3,776
4,409
5,350
- YoY Growth (%)
97.6
-0.7
16.7
21.3
Prov. for Taxation
1,341
1,214
1,499
1,819
- as a % of PBT
35.3
32.1
34.0
34.0
PAT
2,460
2,562
2,910
3,531
- YoY Growth (%)
95.7
4.2
13.6
21.3
Balance Sheet
Y/E March (` cr)
FY18
FY19
FY20E
FY21E
Share Capital
227
227
227
227
Reserve & Surplus
13,349
15,609
18,224
21,397
Net worth
13,576
15,836
18,451
21,623
Borrowing
82,131
87,968
1,00,284
1,16,329
- YoY Growth (%)
54.6
7.1
14.0
16.0
Other Liab. & Prov.
1,539
1,487
1,821
2,351
Total Liabilities
97,245
1,05,291
1,20,556
1,40,304
Investment
2,341
3,999
3,999
3,999
Cash
3,675
3,981
4,680
5,432
Advance
90,738
96,751
1,11,264
1,30,178
- YoY Growth (%)
38.6
6.6
15.0
17.0
Fixed Asset
120
147
154
162
Other Assets
383
413
458
532
Total Asset
97,257
1,05,291
1,20,556
1,40,304
Growth (%)
30.7
8.3
14.5
16.4
May 25, 2019
4
Shriram Transport Fin Co | 4QFY2019 Result Update
Exhibit 5: Key Ratio
Y/E March
FY18
FY19
FY20E
FY21E
Profitability ratios (%)
NIMs
8.5
8.1
8.2
8.3
Cost to Income Ratio
21.3
22.1
22.7
22.5
RoA
2.9
2.5
2.6
2.7
RoE
19.8
17.4
17.0
17.6
Asset Quality (%)
Gross NPAs (%)
9.15
8.3
8.0
7.5
GNPA Amt
7,376
7,100
8,901
9,763
Net NPAs
2.83
2.6
2.4
2.4
NPA Amt
2,131
2,055
2,670
3,124
Provision Coverage
69.1
69.2
70.0
68.0
Credit Cost (AUM)
1.8
2.3
2.1
2.0
Per Share Data (`)
FY18
FY19
FY20E
FY21E
EPS
108
113
128
156
ABVPS
504
607
696
815
DPS
11
11
13
16
BVPS
598
698
813
953
Valuation Ratios
PER (x)
9.7
9.3
8.2
6.8
P/ABVPS (x)
2.1
1.7
1.5
1.3
P/BVPS
1.8
1.5
1.3
1.1
Dividend Yield
1.0
1.1
1.2
1.5
DuPont Analysis
FY18
FY19
FY20E
FY21E
NII
7.9
7.7
7.8
7.9
(-) Prov. Exp.
2.0
2.4
2.2
2.1
Adj. NII
5.9
5.4
5.6
5.8
Other Inc.
0.3
0.1
0.1
0.1
Op. Inc.
6.2
5.5
5.7
5.9
Opex
1.7
1.7
1.8
1.8
PBT
4.4
3.7
3.9
4.1
Taxes
1.6
1.2
1.3
1.4
RoA
2.9
2.5
2.6
2.7
Leverage
6.9
6.9
6.6
6.5
RoE
19.8
17.4
17.0
17.6
Valuation done on closing price of 24/5/19
May 25, 2019
5
Shriram Transport Fin Co | 4QFY2019 Result Update
Research Team Tel: 022 - 39357800
DISCLAIMER:
Angel Broking Limited (hereinafter referred to as “Angel”) is a registered Member of National Stock Exchange of India Limited,
Bombay Stock Exchange Limited, Metropolitan Stock Exchange Limited, Multi Commodity Exchange of India Ltd and National
Commodity & Derivatives Exchange Ltd It is also registered as a Depository Participant with CDSL and Portfolio Manager and
Investment Adviser with SEBI. It also has registration with AMFI as a Mutual Fund Distributor. Angel Broking Limited is a
registered entity with SEBI for Research Analyst in terms of SEBI (Research Analyst) Regulations, 2014 vide registration number
INH000000164. Angel or its associates has not been debarred/ suspended by SEBI or any other regulatory authority for
accessing /dealing in securities Market. Angel or its associates/analyst has not received any compensation / managed or co-
managed public offering of securities of the company covered by Analyst during the past twelve months.
This document is solely for the personal information of the recipient, and must not be singularly used as the basis of any
investment decision. Nothing in this document should be construed as investment or financial advice. Each recipient of this
document should make such investigations as they deem necessary to arrive at an independent evaluation of an investment in
the securities of the companies referred to in this document (including the merits and risks involved), and should consult their
own advisors to determine the merits and risks of such an investment.
Reports based on technical and derivative analysis center on studying charts of a stock's price movement, outstanding positions
and trading volume, as opposed to focusing on a company's fundamentals and, as such, may not match with a report on a
company's fundamentals. Investors are advised to refer the Fundamental and Technical Research Reports available on our
website to evaluate the contrary view, if any
The information in this document has been printed on the basis of publicly available information, internal data and other
reliable sources believed to be true, but we do not represent that it is accurate or complete and it should not be relied on as
such, as this document is for general guidance only. Angel Broking Limited or any of its affiliates/ group companies shall not be
in any way responsible for any loss or damage that may arise to any person from any inadvertent error in the information
contained in this report. Angel Broking Limited has not independently verified all the information contained within this
document. Accordingly, we cannot testify, nor make any representation or warranty, express or implied, to the accuracy,
contents or data contained within this document. While Angel Broking Limited endeavors to update on a reasonable basis the
information discussed in this material, there may be regulatory, compliance, or other reasons that prevent us from doing so.
This document is being supplied to you solely for your information, and its contents, information or data may not be
reproduced, redistributed or passed on, directly or indirectly.
Disclosure of Interest Statement
Shriram Transport Fin
1. Financial interest of research analyst or Angel or his Associate or his relative
No
2. Ownership of 1% or more of the stock by research analyst or Angel or associates or relatives
No
3. Served as an officer, director or employee of the company covered under Research
No
4. Broking relationship with company covered under Research
No
Ratings (Based on expected returns
Buy (> 15%)
Accumulate (5% to 15%)
Neutral (-5 to 5%)
Over 12 months investment period):
Reduce (-5% to -15%)
Sell (< -15)
May 25, 2019
6